About two-thirds of the potato growing area for AG Wright and Son is on rented land, which adds unknowns in terms of soil type and nutrient status.
Farm director Jack Smith explains that 90% of the potato tonnage is grown on contract and optimising yield is key to achieve profitability through contracts. However, making a sustainable margin has been an increasing challenge in recent years with rising prices, especially last year’s fertiliser, fuel and electricity price increase.
Jack says this prompted the business to focus on its inputs and look at how to optimise them. “This was the nudge that now is the right time to take an even closer look at inputs,” he says.
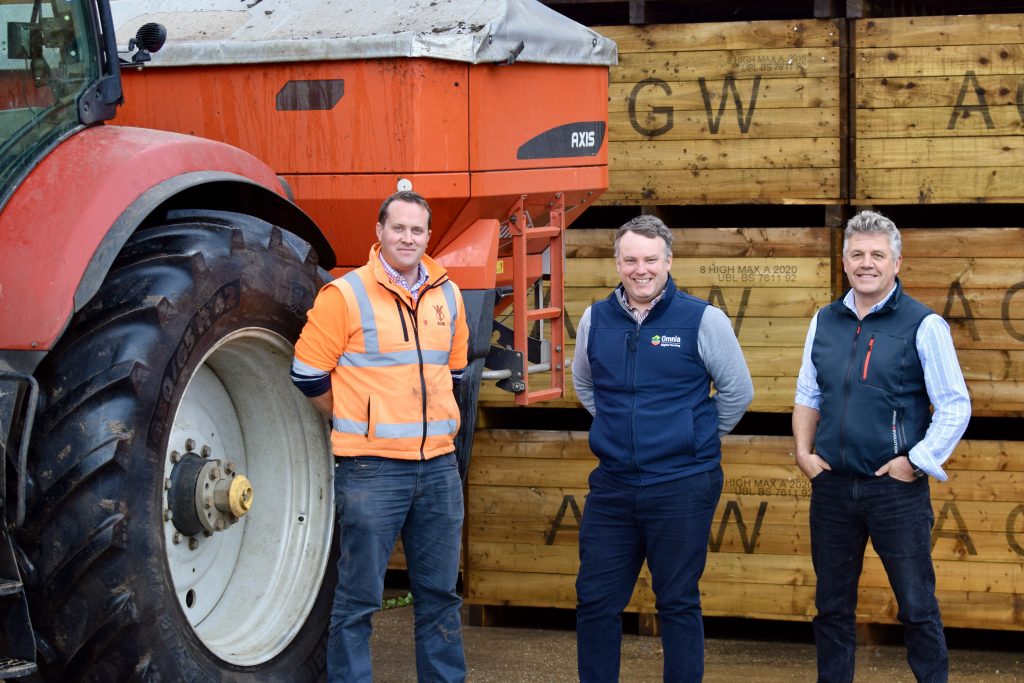
Left to Right: Jack Smith, James Lane, Stefan Williams
Fertiliser Costs
A key part of the total growing cost of potatoes is fertiliser. “What can we do to ensure our fertiliser use is optimised?” says Jack.
Jack’s agronomist, Stefan Williams, works at Farmacy and has several clients using the TerraMap service to gain a better understanding of soils in both owned and rented fields.
However, he also sees a potential role for the tool in making better use of fertiliser inputs such as potash and magnesium.
So how does the TerraMap service work?
James Lane, digital services specialist at Hutchinsons, explains that the sensor measures the variation of four naturally emitted isotopes across a field. Fields are scanned using a gator.
It measures 800 points in each hectare. This indicates where to take soil samples in the field, thereby generating detailed maps with up to 27 layers.
Last year was Jack’s first time using TerraMap and he opted for the standard plus organic matter package, which measures 11 criteria:
- Phosphorus, potassium, magnesium, pH
- Clay (%), sand (%), silt (%), silt/clay fraction and texture
- Elevation
- Organic matter
Looking at phosphate, Stefan says there is variation in fields, but levels are generally indices 3 to 4, suggesting good inherent levels.
“Di-ammonium phosphate is applied on the planter; placing it just below the seed is known to increase tuber numbers. Therefore, DAP is not currently variably applied.”
Two Nutrients
For the other two nutrients, potassium and magnesium, there is scope to vary rates of muriate of potash (MOP) and kieserite (Mg).
Jack explains that their standard approach was to apply in line with RB209 based on a soil sample at field level, but rates are now tailored by zone.
This significantly increases accuracy and targets nutrition where it is required, therefore improving economic, agronomic and environmental practices.
For magnesium, small but available amounts are needed by the plant. Sand land is particularly low in this element; the same approach is used as with MOP to allow for better nutrient use.
He points to one 8.5ha rented field where they found large variation for potash – ranging from index 0.5 to 4.
“We wouldn’t have known it without the mapping. The TerraMap is picking up pockets that standard tests based on the W-pattern would not have identified.”
The Omnia software generates MOP application plans for the spreader, with rates based on RB209 adjusted for anticipated yield.
For example, for an index 2-2.5 field, the business would historically have applied 420kg potassium/ha for a 60t/ha crop. So you would go out and dress at 700kg/ha of MOP across the whole field.
325kg/ha Difference
With Omnia, it generated a variable-rate map ranging from 375kg MOP/ha (index 4) to 700kg MOP/ha (index 0.5). “That’s a 325kg/ha difference in the same field.”
Jack found that he applied 4.2t of product to that field while a blanket rate would have come to 4.9t. Overall, he is seeing a 3-5% saving in MOP and a similar reduction in kieserite.
But he adds that they are not in it for the fertiliser saving; he wants a more uniform crop with optimised yield and fertiliser use.
“It means we no longer overfertilise some areas and underfeed other patches.”
He tried to trim rates before in field trials, but the blanket approach reduced overall yields.
PCN Maps
The Omnia mapping tool is used to generate potato cyst nematode field maps, enabling targeted nematicide applications based on soil results.
AG Wright and Son uses Agri-Tech Services to sample fields ahead of potatoes, taking 180 soil cores in each 1ha block. The resulting egg counts are used to produce maps.
Farmacy potato agronomist Stefan Williams points to one example field with pockets of the pest.
“Some blocks had egg counts at 14, 16 and 18 eggs/g and with these levels, we would not grow a non-tolerant/resistant variety in that field.”
Instead, they opted for a PCN-tolerant/resistant variety and only treated those blocks with a nematicide.
“With full-rate nemathorin costing circa £700/ha, it means you can target areas that need it and save on those that don’t.”
